
June 2025 Market Summary
July 10, 2025
June 2025 Market Summary
Equities End 1H 2025 with Positive June, Oil Prices Surge, Treasury Yields Fall
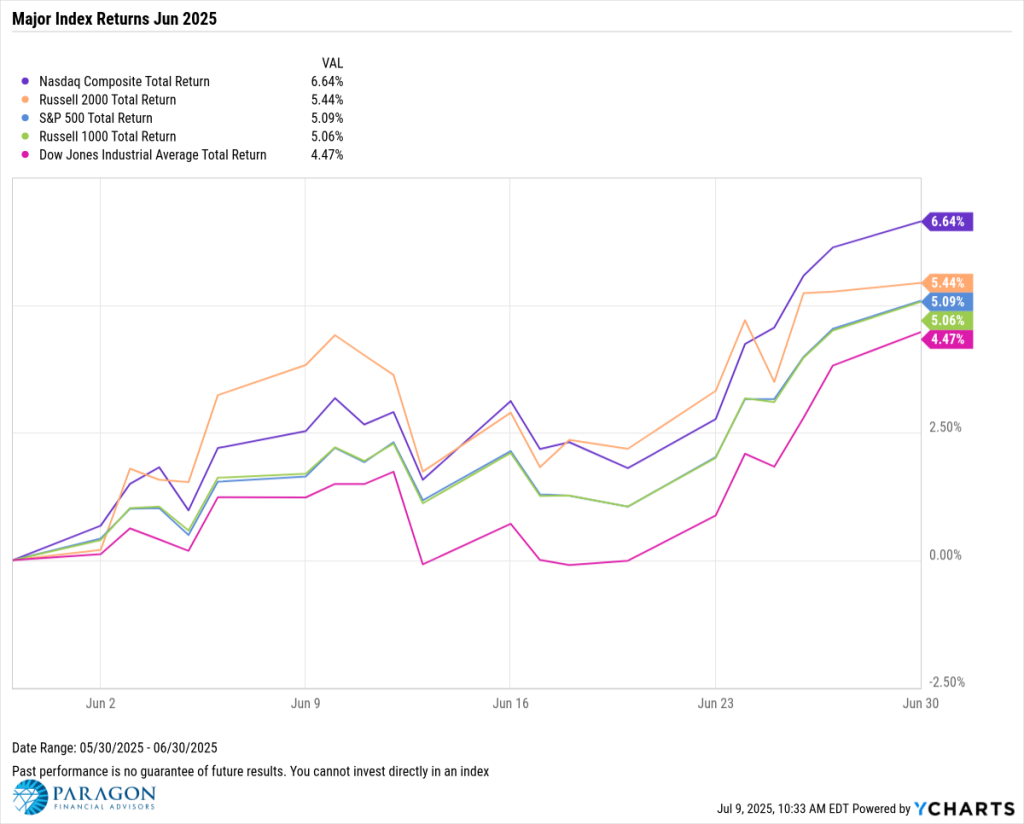
Stocks closed out the first half of 2025 with gains across the boardas indices continued a rapid clawback out of correction territory from earlier in the year. The Dow Jones Industrial Average rose 4.5%, the S&P 500 added 5.1%, and the Nasdaq Composite advanced 6.6%. Eight of the top 10 S&P 500 performers in June were companies in the Information Technology sector; similar to May, companies in the semiconductor and technology hardware & storage industries were the main drivers of higher index performance in June.
The only negative sector in June was the Consumer Staples sector, which slipped 1.6%. The top three sectors were Technology (+9.9%), then Consumer Discretionary (+7.3%), followed by Energy (+4.9%).
2025 Halftime Report
We are already halfway through the year, and 2025 has certainly been a wild ride for equity markets.
Following two consecutive calendar years of strong performances, the Dow, Nasdaq, and S&P 500 got off to modestly positive starts in 2025. That all changed when the growing imposition of trade tariffs on foreign countries and investors fleeing to the safety of short-term treasuries caused U.S. indices to all plummet by double-digit percentages. (The Nasdaq briefly entered into a bear market in early April.)
However, all three indices returned to setting new all-time highs by the end of Q2 in a remarkable V-shaped recovery. The S&P 500 ended the first half of the year up 5.5%, lifted higher by the Communication Services (+12.1%), Industrial (+12.0%), and Technology sectors. The Technology sector logged the biggest reversal, coming back from down as much as 22.7% YTD through April 8th to end the six-month period up 8.9%.

Equity Performance
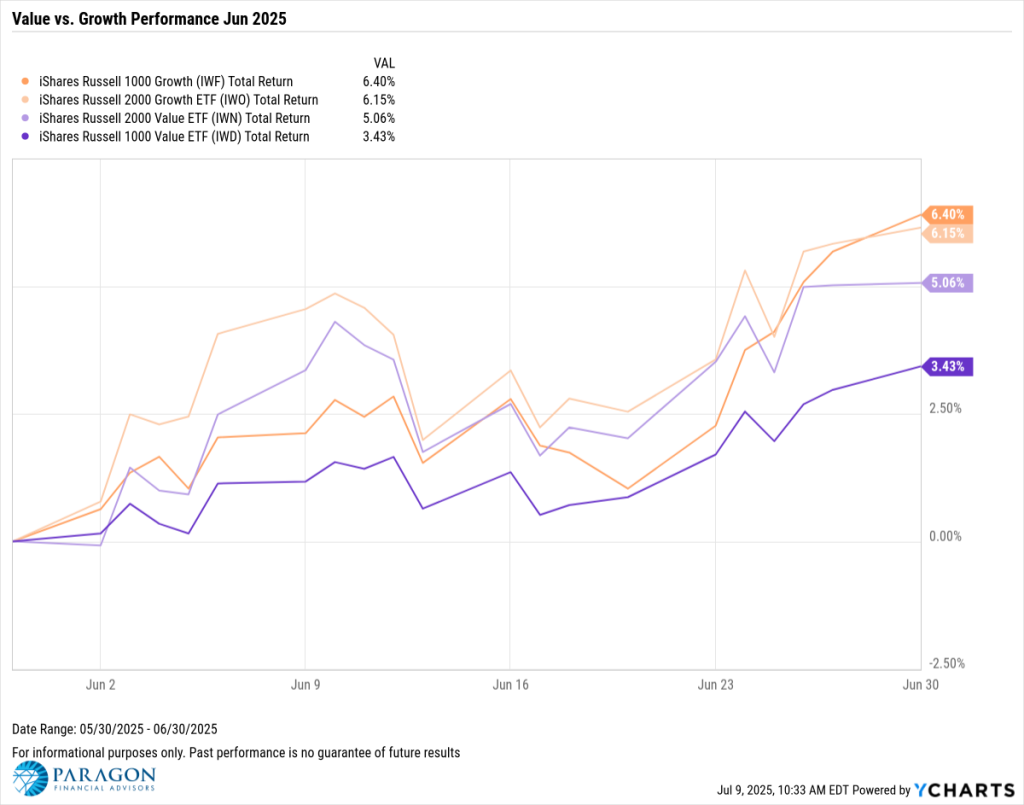
Equities Close Out First Half of the Year on Strong Note, Growth and Information Technology Lead

Economic Data Overview
Oil Prices Spike, Services Sector Contracts for First Time in 12 Months
Employment
The unemployment rate remained at 4.2% for the third-straight month in May, and the labor force participation rate fell 0.2 percentage points to 62.4%. 139,000 jobs were added to the U.S. economy in May, according to the most recent nonfarm payrolls report, below the downwardly revised 147,000 in April but above the Dow Jones estimate of 125,000.
Consumers and Inflation
The US inflation rate held steady at 2.35% in May, as did core inflation at 2.79%. The US Consumer Price Index rose by 0.1% MoM in May, and US Personal Spending contracted 0.14% MoM, its second contraction since March 2023.
The Federal Reserve maintained its key Fed Funds Rate target range of 4.25%-4.50% at the FOMC’s June 18th meeting, the fourth consecutive meeting in which it has voted to do so. The next meeting will take place on July 30th. Despite recent calls from the U.S. president for the rate to be slashed to 1%, investors anticipate the Fed will once again leave the target rate unchanged at 4.25%-4.50%, according to the CME FedWatch tool.
Production and Sales
The US ISM Manufacturing PMI increased 0.5 points in June to 49.0, ending a four month streak of consecutive declines but still just within contraction territory. The Services PMI fell 1.7 points between April and May to 49.9, its first contractionary reading since last June. The YoY US Producer Price Index rose slightly to 2.62% in May after a drastic drop between March and April. US Retail and Food Services Sales posted the largest MoM decline since April 2023, contracting 0.91% between April and May.
Housing
US New Single-Family Home Sales plummeted 13.7% MoM in May, the largest monthly decline since June 2022. Existing Home Sales rose 0.8% MoM. The Median Sales Price of Existing Homes climbed 2.1% in May to $422,800, closing within 1% of its all-time high of $426,900. Mortgage rates stayed relatively stable throughout June, continuing a year-long trend; the 15-year Mortgage Rate was 5.89% as of June 26th, while the 30-year closed the month at 6.77%.
Commodities
The price of gold experienced volatility in June but ended the month slightly higher after snapping a four-month win streak in May. The SPDR Gold Shares ETF (GLD) rose 0.4% in June to $308.43 per share and set a new all-time high halfway through the month. Oil prices spiked in June as a result of the Israel-Iran conflict and concerns over diminished production in the region; the price of Brent crude surged as much as 25% in June before retracing to $68.15 per barrel as of June 30th, a monthly increase of 6%. WTI jumped 7.9% higher to $66.30. Despite the volatility in oil prices, the average price of gas stayed unchanged at $3.29 per gallon MoM.
Major cryptocurrencies posted mixed performances in June. Bitcoin rose 4.2% in June to end the month at $108,396.60, bringing the asset class up 17% YTD. Ethereum slipped 0.9% to $2,502.67 as of June 30th, pulling the second-largest cryptocurrency by market cap down 25.5% YTD and 48% below its all-time high.
Fixed Income Performance: Insights into Bond ETFs and Treasury Yields


Disclaimer
©2025 YCharts, Inc. All Rights Reserved. YCharts, Inc. (“YCharts”) is not registered with the U.S. Securities and Exchange Commission (or with the securities regulatory authority or body of any state or any other jurisdiction) as an investment adviser, broker-dealer or in any other capacity, and does not purport to provide investment advice or make investment recommendations. This report has been generated through application of the analytical tools and data provided through ycharts.com and is intended solely to assist you or your investment or other adviser(s) in conducting investment research. You should not construe this report as an offer to buy or sell, as a solicitation of an offer to buy or sell, or as a recommendation to buy, sell, hold or trade, any security or other financial instrument. For further information regarding your use of this report, please go to: ycharts.com/about/disclosure
RISK DISCLOSURE: Investing involves risk including the potential loss of principal. No investment strategy can guarantee a profit or protect against loss in periods of declining values. Past performance does not guarantee future results.
This material is for information purposes only and is not intended as an offer or solicitation with respect to the purchase or sale of any security. The content is developed from sources believed to be providing accurate information; no warranty, expressed or implied, is made regarding accuracy, adequacy, completeness, legality, reliability, or usefulness of any information. Consult your financial professional before making any investment decision. For illustrative use only.
SECURITY REMINDER: E-mail transmission may not be secure. If you would like to be contacted by other means please alert Paragon Financial Advisors. By your use of email, Paragon Financial Advisors assumes you agree to our transmission of information by e-mail. Please do NOT send Social Security numbers or account numbers, confidential or privileged information via E-mail.
CONFIDENTIALITY NOTICE: All e-mail sent to or from this address will be received or otherwise recorded by Paragon Financial Advisors and is subject to archival, monitoring or review by, and/or disclosure to the Securities and Exchange Commission. This email and any files transmitted with it are confidential and are intended solely for the use of the individual or entity to which they are addressed. This communication represents the originator’s personal views and opinions, which do not necessarily reflect those of Paragon Advisors. If you are not the original recipient or the person responsible, be advised that you have received this email in error, and that any use, dissemination, forwarding, printing, or copying of this email is strictly prohibited. If you received this email in error, please immediately notify info@paragon-adv.com.
Category

© 2026 Paragon Advisors, LLC. All rights reserved. | Site Credit: Kasey S Consulting