
The S&P Just Crossed 6000. Now What?
December 12, 2024
The S&P 500 Just Crossed 6,000. What’s Next?
The S&P 500 took over headlines on a Monday in mid-November when it closed above 6,000 points for the first time.

From humble beginnings at just 16.66 points in January 1950, the widely-followed benchmark index has traveled far in the almost 75 years since, generating incredible wealth along the way.
We’ll explore the S&P 500’s journey to each 1,000-point milestone, lessons about volatility learned on the path to each level, and answer the question: How can we prepare our clients for ups and downs on the road to 7,000 and beyond?
Where Is the Market Right Now?
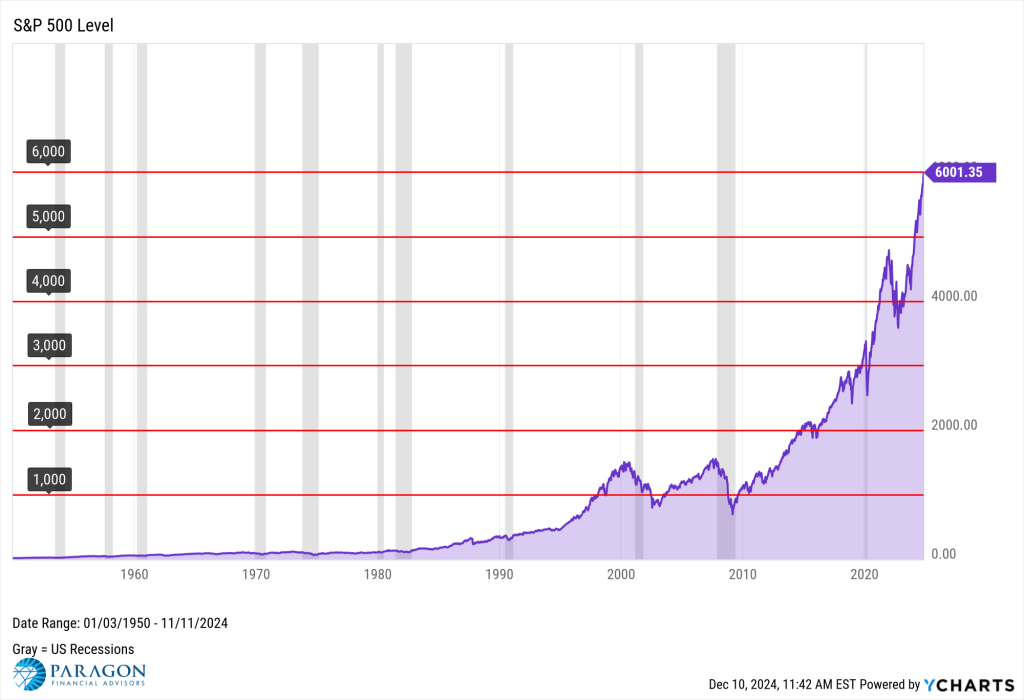
The S&P 500 closed above 6,000 for the first time on November 11th, 2024, at 6,001.35. The index’s journey from 16.66 to 6,000 elapsed 74 years, 10 months, and 9 calendar days.
Each horizontal red line marks a 1,000-point increment, while vertical gray bars indicate a recession period.
Early Innings: The S&P 500’s Rise to 1,000
It took the S&P 500 index nearly half a century to reach 1,000 points. Starting at 16.66 on the first trading day of 1950, the S&P 500 closed above the 1,000-point milestone for the first time 48 years and 1 month later.
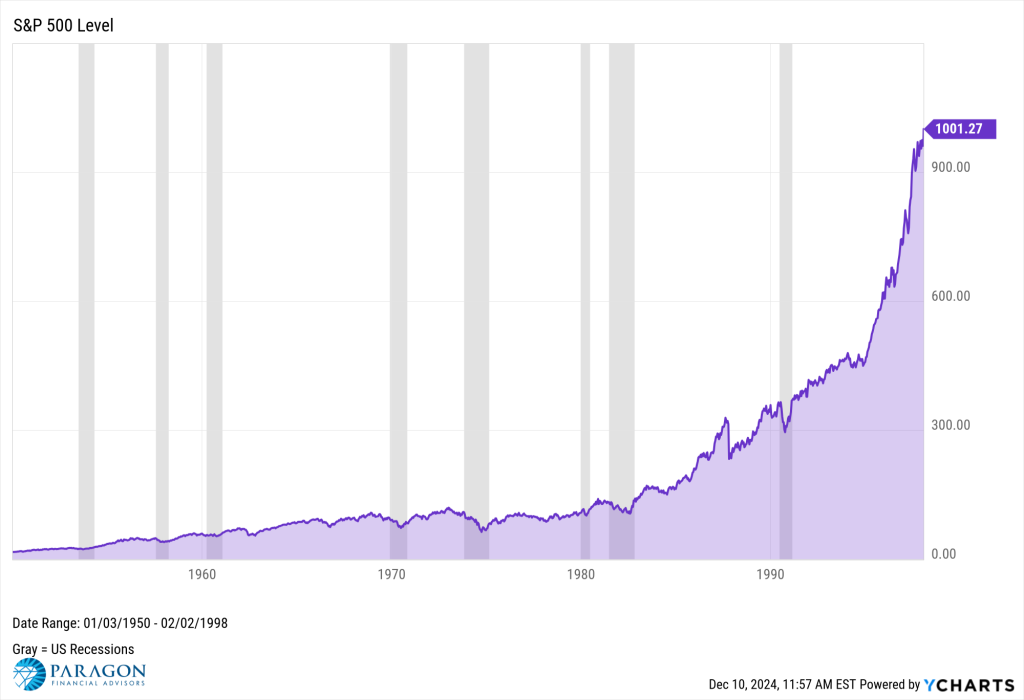
Though the chart above might show a fairly smooth rise to 1,000, including accelerated growth starting in the 1980s, there were several major bumps along the way. In that 48-year journey, there were seven drawdowns of 20% or more, with the largest being 48.2% in October 1974. Eight recessions also took place.

What Happened After the S&P 500 Reached 2,000?
After closing above 2,000 for the first time, the S&P 500 advanced to 3,000 in 4 years, 10 months, and 17 days. It closed above 3,000 on July 12th, 2019. Similar to its journey from 1,000 to 2,000, the index rose from 2,000 to 3,000 in exponentially less time.
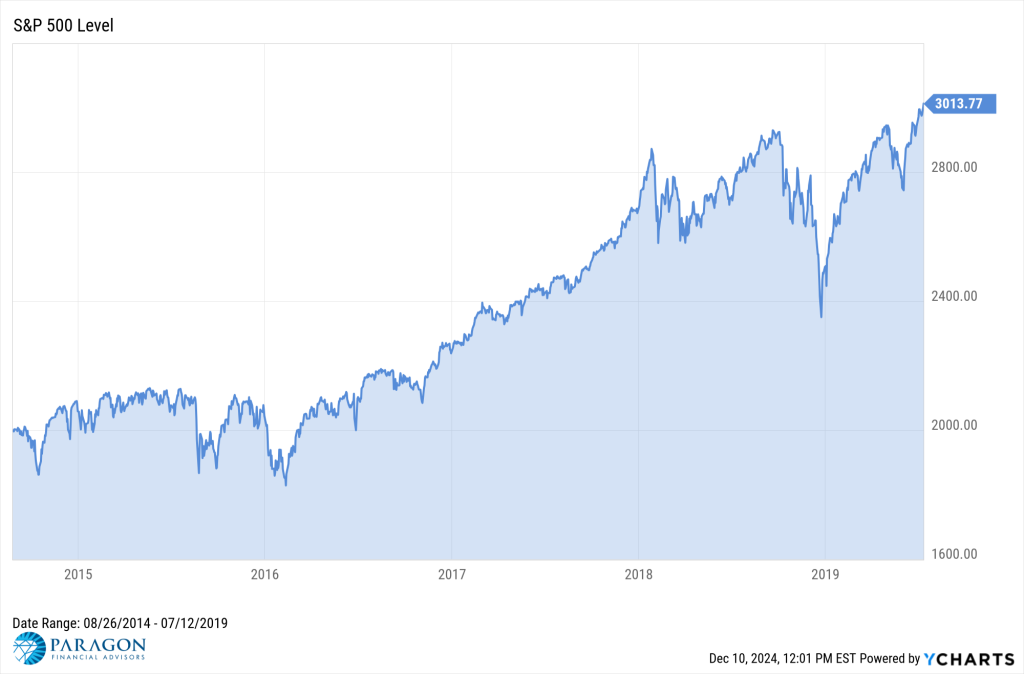
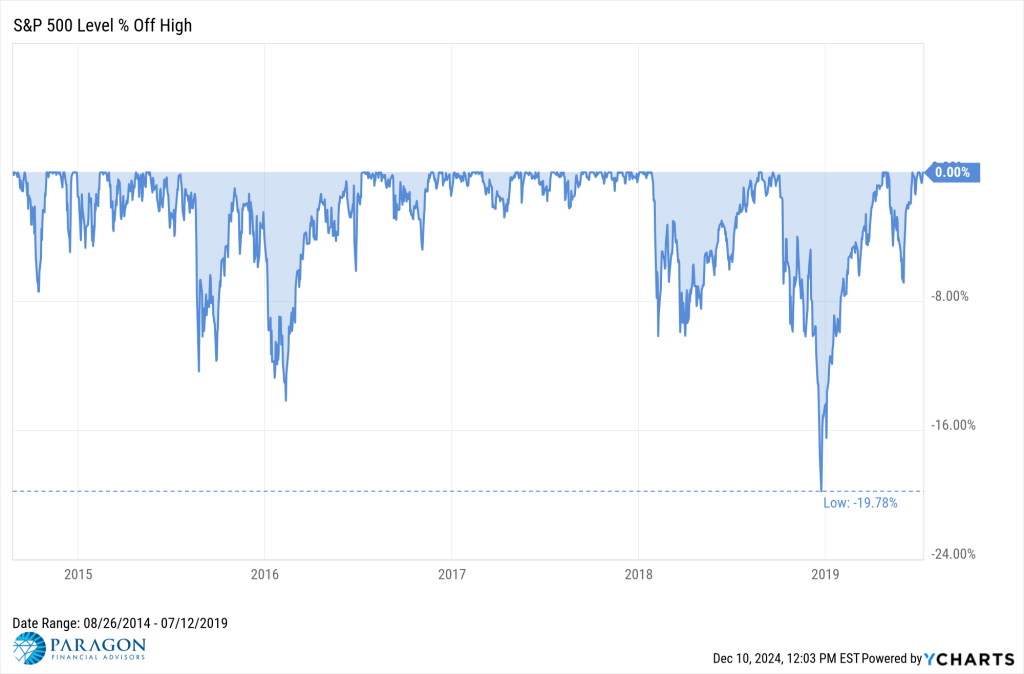
There were neither any recessions nor any bear markets (generally defined as drawdowns of 20% or more) in this five-year span. The largest drawdown during this period was 19.8% in December of 2018, along with two other drawdowns of at least 10%.
What Happened After the S&P 500 Reached 3,000?
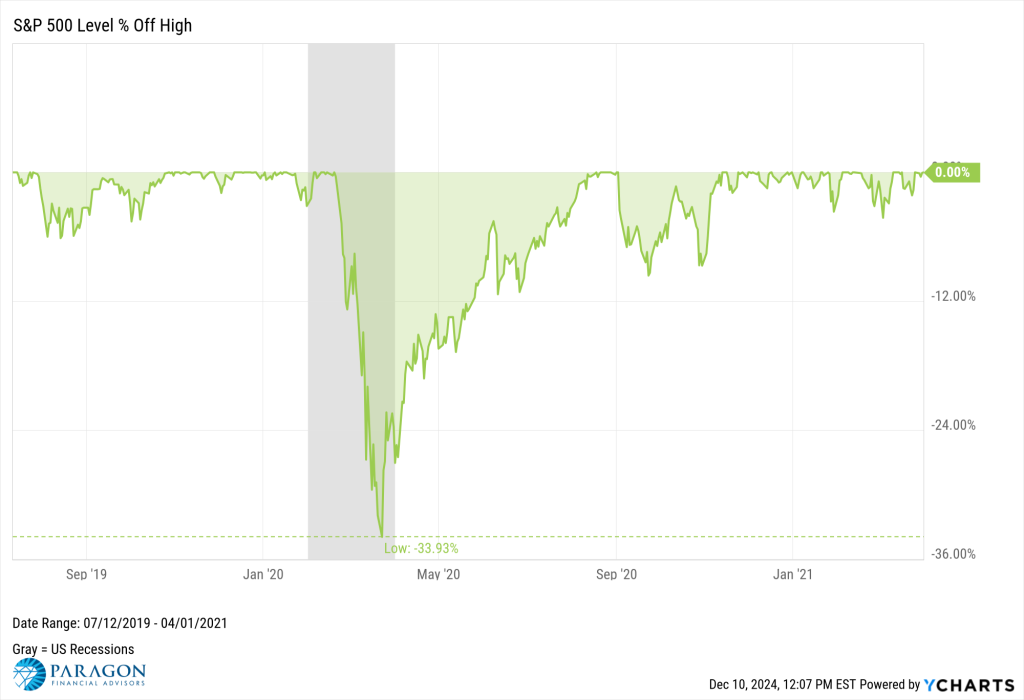
The S&P 500’s run from 3,000 to 4,000 took an even shorter amount of time. The index climbed another 1,000 points in just 1 year, 8 months, and 21 days, reaching 4,000 on April 1st, 2021. Despite the event occurring on April Fools Day, such a rapid 1,000-point advance was no joke.

However, even 1,000-point jumps as fast as this one aren’t immune from major drawdowns. The Covid-19 pandemic in early 2020 sent the S&P 500 down almost 34% in a matter of weeks. Fortunately for long term investors, the index roared all the way back, setting a new all-time high five months later on August 18th, 2020.
What Happened After the S&P 500 Reached 4,000?
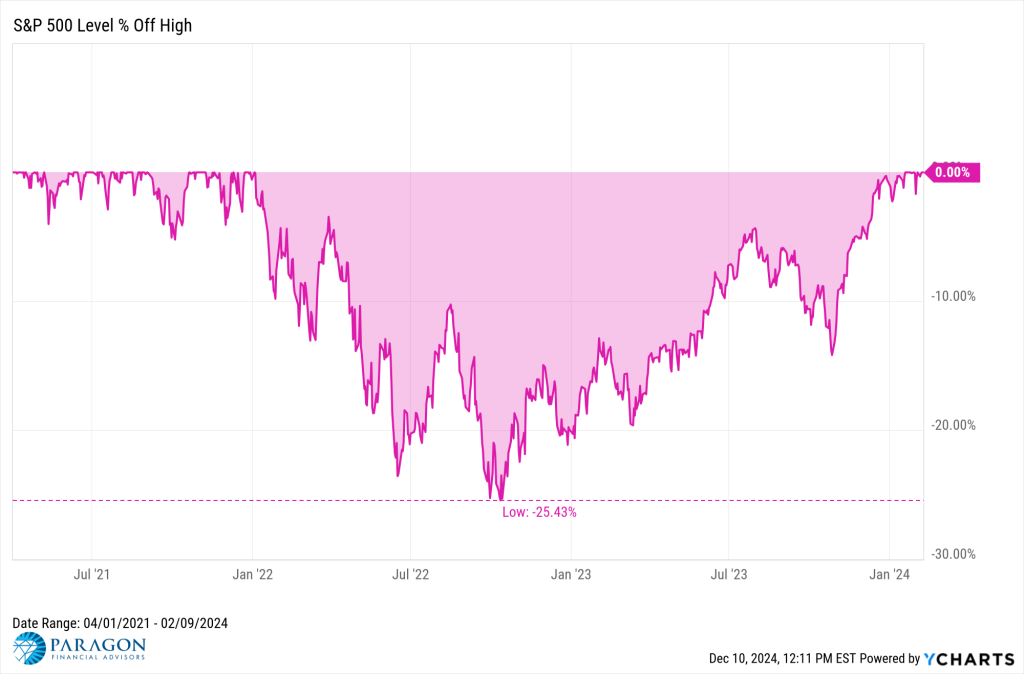
The S&P 500 traveled from 4,000 to 5,000 in 2 years, 10 months, 9 days. Though it took about twice as long as the journey from 3,000 to 4,000, this fifth 1,000-point advance was the index’s third-fastest.
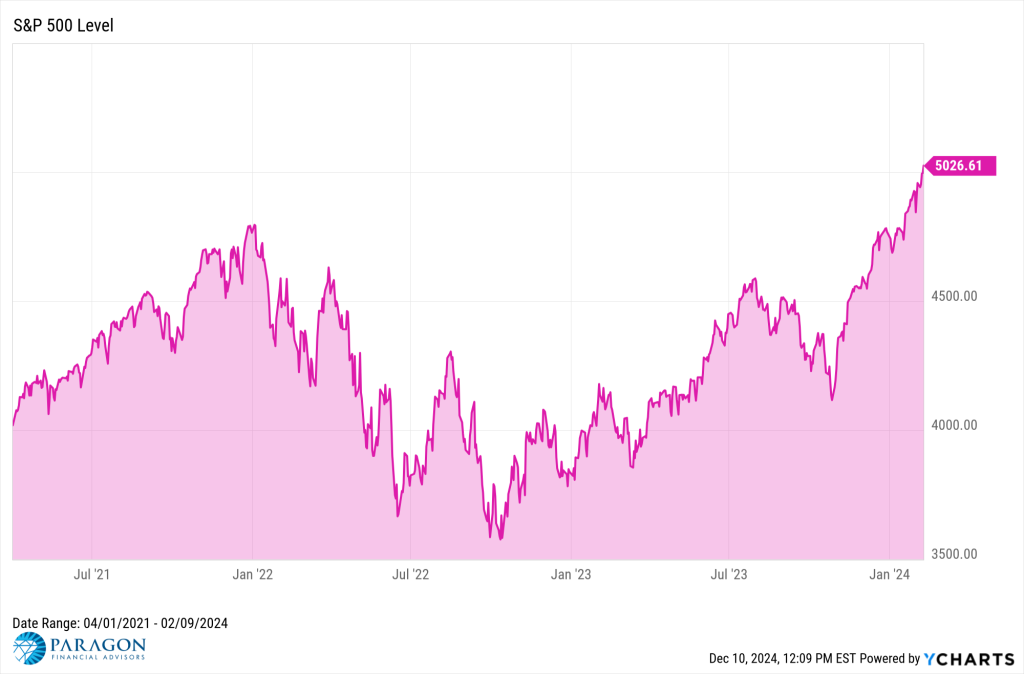
On the road to 5,000, market participants endured a prolonged drawdown first. The S&P 500 entered this decline after January 3rd, 2022, sank to a max drawdown of 25.4% on October 12th, 2022, and didn’t set a new all-time high for a little over two years until January 19th, 2024. Three weeks later, the index crossed the 5,000 mark.
What Happened After the S&P 500 Reached 5,000?
That brings us to today. The S&P 500 traveled from 5,000 to 6,000 in 9 months and 3 days, the shortest 1,000-point jump on record.
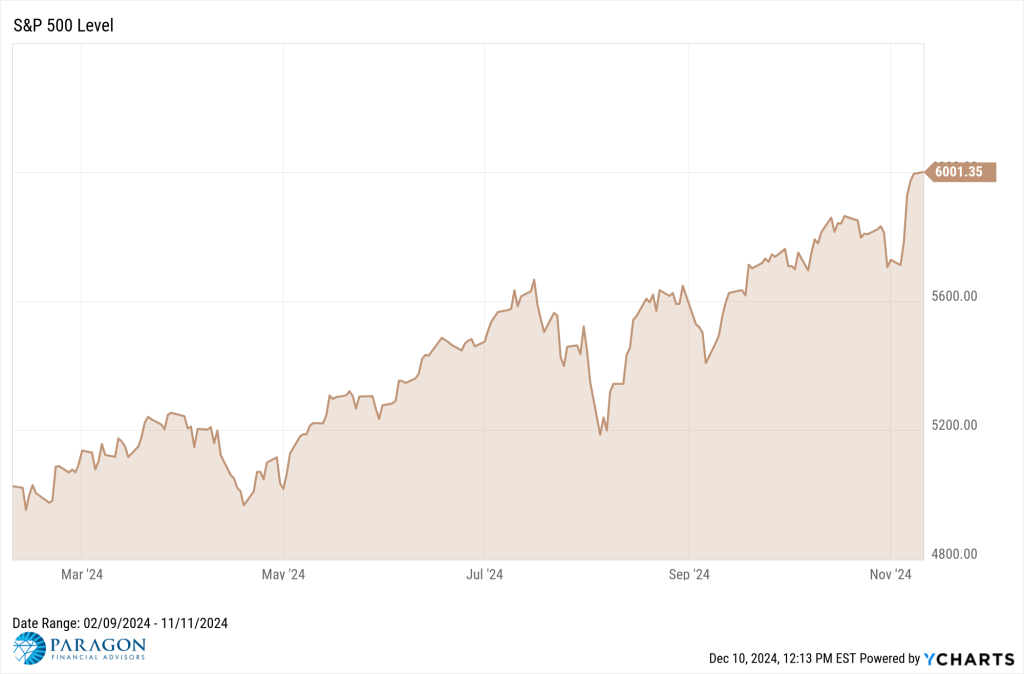
There was relatively little turbulence in the nine month journey from 5,000 to 6,000. The largest drawdown was only 8.5%, and fully recovered in six weeks’ time.

What Could Happen Next for the S&P 500?
As the S&P 500 progresses to the next level of 7,000, it’s important to note that the journey to each milestone was marked by periods of volatility. Most 1,000-point marks included drawdowns of over 20%.
At the same time, the amount of time it has taken to achieve new 1,000-point thresholds has gotten shorter in duration. We’ll explore the S&P 500’s journey to each 1,000-point milestone, lessons about volatility learned on the path to each level, and answer the question: How can we prepare our clients for ups and downs on the road to 7,000 and beyond?
Disclaimer
©2024 YCharts, Inc. All Rights Reserved. YCharts, Inc. (“YCharts”) is not registered with the U.S. Securities and Exchange Commission (or with the securities regulatory authority or body of any state or any other jurisdiction) as an investment adviser, broker-dealer or in any other capacity, and does not purport to provide investment advice or make investment recommendations. This report has been generated through application of the analytical tools and data provided through ycharts.com and is intended solely to assist you or your investment or other adviser(s) in conducting investment research. You should not construe this report as an offer to buy or sell, as a solicitation of an offer to buy or sell, or as a recommendation to buy, sell, hold or trade, any security or other financial instrument. For further information regarding your use of this report, please go to: ycharts.com/about/disclosure
RISK DISCLOSURE: Investing involves risk including the potential loss of principal. No investment strategy can guarantee a profit or protect against loss in periods of declining values. Past performance does not guarantee future results.
This material is for information purposes only and is not intended as an offer or solicitation with respect to the purchase or sale of any security. The content is developed from sources believed to be providing accurate information; no warranty, expressed or implied, is made regarding accuracy, adequacy, completeness, legality, reliability, or usefulness of any information. Consult your financial professional before making any investment decision. For illustrative use only.
SECURITY REMINDER: E-mail transmission may not be secure. If you would like to be contacted by other means please alert Paragon Financial Advisors. By your use of email, Paragon Financial Advisors assumes you agree to our transmission of information by e-mail. Please do NOT send Social Security numbers or account numbers, confidential or privileged information via E-mail.
CONFIDENTIALITY NOTICE: All e-mail sent to or from this address will be received or otherwise recorded by Paragon Financial Advisors and is subject to archival, monitoring or review by, and/or disclosure to the Securities and Exchange Commission. This email and any files transmitted with it are confidential and are intended solely for the use of the individual or entity to which they are addressed. This communication represents the originator’s personal views and opinions, which do not necessarily reflect those of Paragon Advisors. If you are not the original recipient or the person responsible for delivering the email to the intended recipient, be advised that you have received this email in error, and that any use, dissemination, forwarding, printing, or copying of this email is strictly prohibited. If you received this email in error, please immediately notify info@paragon-adv.com
Category
© 2026 Paragon Advisors, LLC. All rights reserved. | Site Credit: Kasey S Consulting